
Core web vitals are a set of metrics that measure the user experience of web pages. They focus on loading performance, interactivity, and visual stability of page content. The Core Web Vitals metrics are: Largest Contentful Paint (LCP), First Input Delay (FID), and Cumulative Layout Shift (CLS).
LCP (Largest Contentful Paint) is a metric that measures the time it takes for the largest content element on a page to render. It is a key metric for understanding the performance of a page, as it is the first major visual element that users see when they visit a page.
Optimizing Web Core Vitals results, notes
To speed up the loading of the site and improve performances I’ve removed Facebook script sdk.js and loaded it only when the user requests to login, when the login HTML layer is shown.
Also implemented YouTube facade. YouTube iframe has a js file greater than 500kb!
Merged and minified local CSS and javascript, also ported jQuery, normalize and other external resources in local files (and merged all together).
Final page HTML output is minfied and cached (to minify I’ve used this PHP).
I’ve reduced the size of the CMP to avoid Web Vitals consider it the LCP element. With Quantcast CMP it was a bit tricky, done using their advanced CSS feature (CSS code below in comments).
Another tip read around the web is to remove lazy attribute from important pic if it is the LCP element (done, but I can’t verify if it is working, since that image was already the LCP element).
Here this site suggests to add fetchpriority attribute on important image (inserted, but I can’t verify if it is working, since that image was already the LCP element).
I also changed the expiry time of the assets in the CDN, from 1h to 365d, it needs to be checked because there are also JS and CSS resources in the CDN which could be unpleasant to have difficulty refreshing cache. (Not tested, but I have to).
Exaustive article here about image tag and performance CWV.
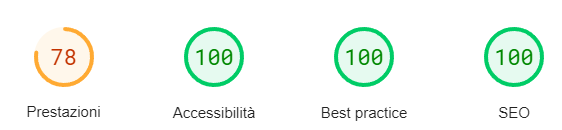
Fixed all Best practices, SEO and Accessibility pointed by Google page speed test.
I hope this is enough!
TO DO: Check if results get better in Search Console > Essentials.

Hi Giulio, how have you fixed Quantcast CMP? There’s an example site where I can see the final result please? Thanks!
I don’t know if “fixed” is the correct word. I’ve modified the CSS settings overrides with these rules. They reduce a bit the CMP size and delay the visualization after 3 seconds. In my case now the first image is the LCP element (this was what I want) and global Performances value has improved from < 50 to ~60 or grater depending on page templates.
Here is the css used:
#qc-cmp2-ui {transform:scale(.9);}.qc-cmp2-container {position: relative; z-index: 10000; -webkit-animation: 3s ease 0s normal forwards 1 fadein; animation: 3s ease 0s normal forwards 1 fadein;}
@keyframes fadein{ 0% { opacity:0; } 66% { opacity:0; } 100% { opacity:1; } }
@-webkit-keyframes fadein{ 0% { opacity:0; } 66% { opacity:0; } 100% { opacity:1; } }